Plotting examples
[1]:
import matplotlib as mpl
import matplotlib.pyplot as plt
from lofarantpos.db import LofarAntennaDatabase
from lofarantpos.plotutil import *
[2]:
plt.rcParams["figure.figsize"] = (8, 8)
[3]:
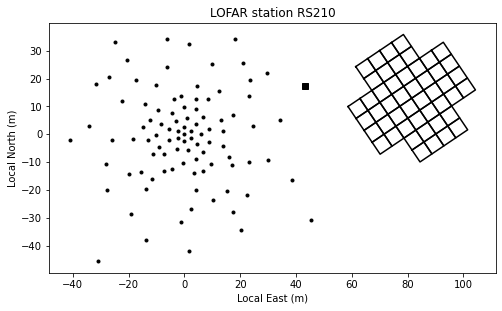
plot_station("RS210")
[4]:
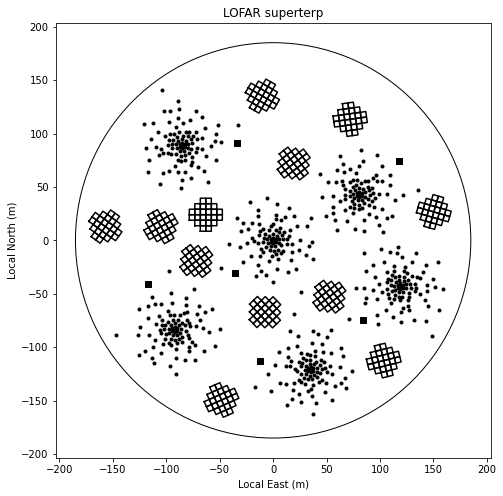
plot_superterp(circle=True)
[5]:
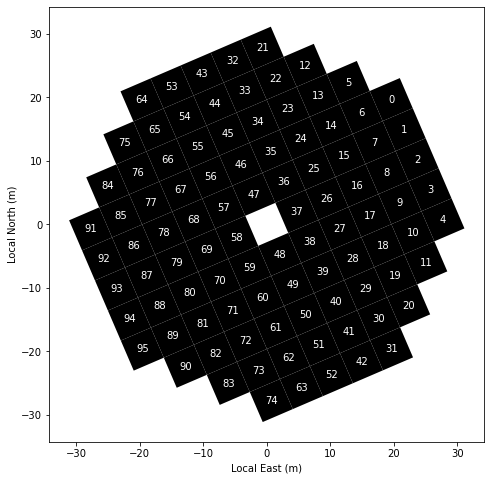
plot_hba("LV614", labels=True, tilestyle="filled")
[6]:
plot_lba("CS001", labels=True)
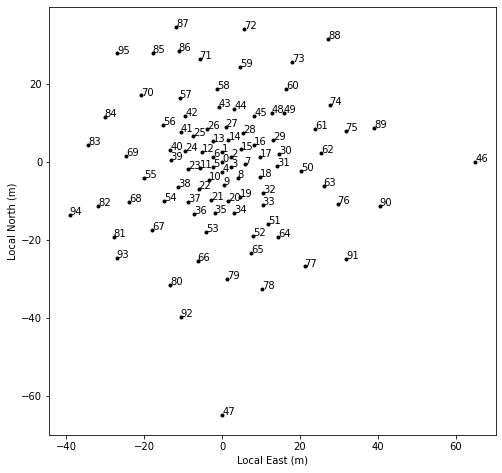
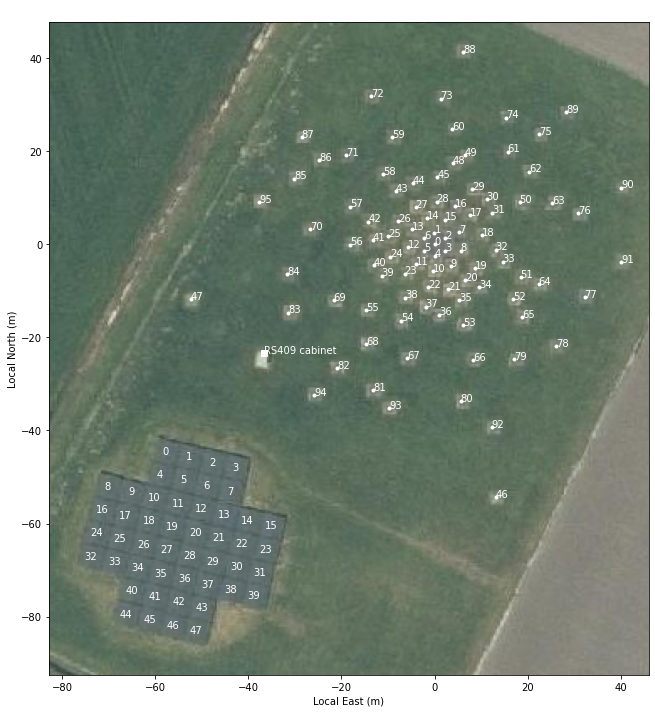
[7]:
with plt.rc_context(
    {
        "lines.markerfacecolor": "white",
        "lines.markeredgecolor": "white",
        "text.color": "white",
        "figure.figsize": (12, 12),
    }
):
    plot_station("RS409", background="luchtfoto", tilestyle=None, labels=True)
[8]:
with plt.rc_context({"lines.markersize": 0.3, "figure.figsize": (12, 12)}):
    plot_core(background="Carto_Light_No_Labels", tilestyle="filled", circle=False)

[9]:
db = LofarAntennaDatabase()
lofar_centre = db.phase_centres["CS002LBA"]
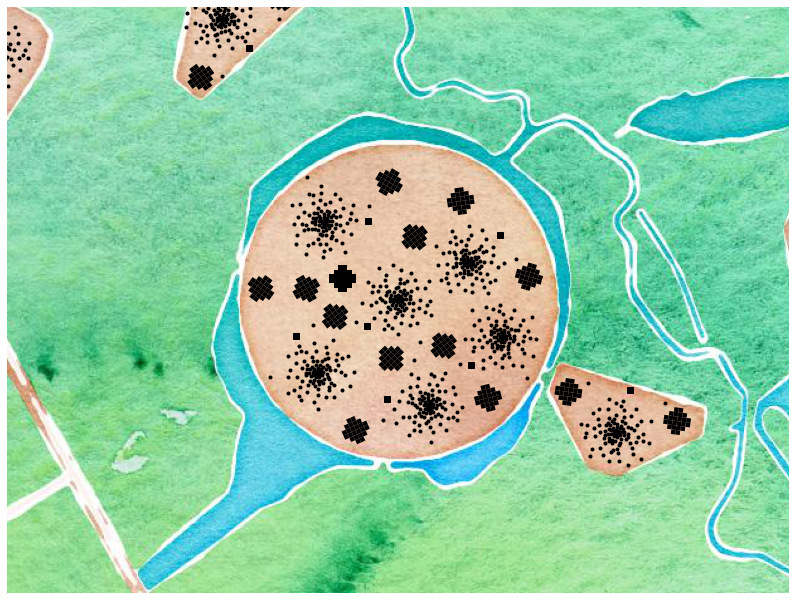
with plt.rc_context({"lines.linewidth": 0.5}):
fig, ax = plt.subplots(figsize=(14, 14))
plot_superterp(ax=ax, circle=False, tilestyle="filled")
ax.set_xlim(-0.7 * 640, 0.7 * 640)
ax.set_ylim(-0.7 * 480, 0.7 * 480)
ax.set_aspect("equal")
# add_background(ax, db.phase_centres["CS002LBA"], "luchtfoto", zoom=16)
# add_background(ax, db.phase_centres["CS002LBA"], "Stamen_Toner", zoom=16)
# add_background(ax, db.phase_centres["CS002LBA"], "Carto_Light_No_Labels", zoom=18)
add_background(ax, lofar_centre, "Stamen_Watercolour", zoom=16)
plot_station("CS011", ax=ax, centre=lofar_centre, tilestyle="filled")
plot_station("CS013", ax=ax, centre=lofar_centre, tilestyle="filled")
plot_station("CS021", ax=ax, centre=lofar_centre, tilestyle="filled")
ax.set_axis_off()